

Many of those who advocate sweeping changes or a fundamental switch of model from our National Health Service to systems based on “social health insurance” focus only on the strengths of other systems, ignoring higher costs and other weaknesses, and the relative strengths in some areas of the NHS model.
There is no one correct way to compare the NHS with other systems: each comparison produces a distinctive result, and will yield different results in different decades, dependent on the government of the day.
Would a system social health insurance solve our healthcare crisis?
Three factor comparison
This article will compare the NHS with other systems from three different criteria: performance and outcomes; capacity and workforce and capital investment.
Many comparisons make reference to the same core sets of statistical information, notably the statistics published each year by the Organisation for Economic Cooperation and Development (OECD, comprising the 33 wealthiest countries in the world), the European Union (now excluding the UK) and the World Health Organisation. Studies therefore inevitably overlap with each other to some extent, but we will examine each in turn.
Given the space limitation, this brief article will simply state that a swift glance at the WHO statistics should be enough to prove that exaggerated claims that the NHS has declined to anything comparable to “third world” levels are completely inappropriate.
Indeed they are insulting to the billions of people whose minimal levels of health care provision in the 2020s shames the wealthier countries that signed up at in 1978 to support the drive for ‘Health For All’ by the year 2000, but did little or nothing to achieve it. The comparisons that are valid are between the UK as a high income country with its high income peers.
It’s also worth noting that the pressures of the Covid-19 pandemic, which reached its peak in 2020-21 have distorted both Gross Domestic Product figures and levels of health spending in many countries, so it is probably easier to detect underlying comparisons from pre-pandemic figures.
1. Performance and outcomes
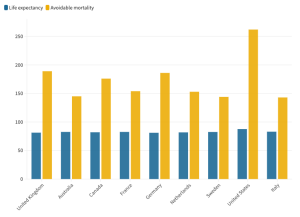
A 2019 study by academics from the London School of Economics and Harvard University set out to compare how the NHS was performing compared with health systems in nine high income countries[1].
It showed that the UK spent the least per capita on healthcare, (just 67% of the average spending per capita of the study group, although it’s worth noting that the 9-country group itself includes several of the highest-spending countries (Netherlands, Switzerland and the US).
UK health spending per capita was close to the OECD average and slightly above the average spend of EU member states – which include a number of much lower spending central and east European countries).
However the UK also had slightly below average life expectancy, and the lowest provision of nurses and doctors. It had seen the greatest decrease in numbers of medical graduates from 2010-2017, as well as a decrease in numbers of practising nurses, with numbers of nursing graduates just half the level in the 9-country group and below the OECD and EU averages.
Partly as a result of this the UK was also far more dependent on foreign-trained doctors and nurses. And with fewer doctors in post per head, GPs in the UK spent the lowest amount of time per consultation, with 92% spending less than 15 minutes per patient, compared with an average of just 38% primary care physicians in the 9-country group.
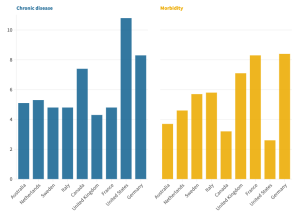
The UK was also below average on patient safety and public health, on preventable deaths, maternal and infant mortality and on survival rates for cancer survival (breast, cervical, colon and rectal cancer).
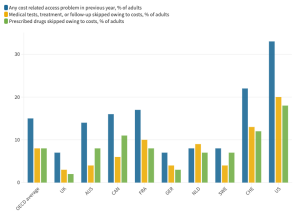
However, surprisingly, it also had the lowest rates of unmet need, and showed “pockets of good performance”. The UK also performed better than 9-country average on avoiding postoperative deep venous thrombosis after joint surgery and healthcare acquired infections, and a smaller proportion of patients reported problems with care coordination and discharge planning.
44% of UK adults reported that they thought the healthcare system worked well (compared with the study average of 45%), although this had declined by 19 percentage points since 2010.
The study concludes:
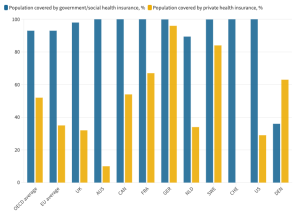
“Despite spending less than comparators, the UK NHS manages to achieve universal population coverage with perceptions of access that were among the highest of all countries examined, while utilisation of care was lower than the average of comparators. However, health service outcomes and measures of population health status are among the lowest in the group and have worsened over the past decade.”
The authors come to the same view as health campaigners in the UK: that the comparatively weak and declining British performance stems from a lack of adequate funding:
“health service outcomes and measures of population health status are among the lowest in the group and have worsened over the past decade. Taken together, these results suggest that, if the UK NHS wants to achieve comparable health outcomes to other high income countries, or even improve outcomes, it needs to invest more on factors that can reverse the decline of health service outcomes and health status overall.”
 2. Capacity
 2. Capacity
Other comparative studies focus specifically on capacity issues, and one of the most helpful of these, published in September 2019 looks at data on hospitals in Europe. It makes few specific references to the UK, but charts show us about mid-table on the percentage of health spending going to hospital care (42% in 2016).
It shows the UK closed 46,000 beds between 2006 and 2016, second only to France, which closed almost 47,000 but still has more than twice as many beds. By contrast Germany closed fewer than 20,000 beds, and still had around four times the UK number of hospital beds in 2016.
And few few campaigners will be surprised to see the UK close to the bottom of the league for beds per 100,000 population, having closed 27% of its beds in the decade to 2016 – a cutback only exceeded by Ireland (-43%) and Finland (-43%). The Chart shows only Portugal, Spain and Sweden had fewer beds per head than the UK, and we know the Swedish system, run by local government, has always been much better integrated with social care, and therefore better able to use hospital beds efficiently.
The Health Foundation’s REAL Centre is a useful source of figures for England’s NHS where the run-down of beds has been the greatest: it shows England had just 2 acute beds per 1,000 population in 2018, near the bottom of the OECD league table, level with Canada and Sweden, and above only China and Colombia.
With acute bed numbers having steadily fallen since 2010, with admissions rising, it’s no surprise that England’s bed occupancy levels are among the highest, nudging 90% in 2018: but more recent figures from NHS Providers show much higher occupancy in the winter peak of 2018-19, and the reduction in numbers of beds in use since Covid have further increased occupancy rates – and the resulting delays in admitting emergency patients and elective cases.
Efforts to improve performance on cancer care and speedy diagnosis and treatment of other conditions are hampered by the UK ranking near the bottom (35/39) of the OECD comparison of provision of MRI and CT scanners, although efficient use of the limited capacity means the UK is mid table for numbers of MRI scans – but achieves a much lower rank for numbers of CT scans delivered.
3. Capital investment
OECD figures show the UK in the lower ranks (30/37) for capital investment that is key to increasing provision and maintenance of equipment and buildings for modern methods of diagnosis and treatment.
In January the Health Foundation warned that with high levels of inflation, “core day-to-day spending on [England’s] NHS will rise by 2% a year by 2024/25, while capital spending will grow by just 0.2%.” Additional 2019 reports and some telling graphs show how the value of machinery and equipment per UK health worker has for years been lagging far behind other countries, with capital investment falling in real terms since 2010.
If the UK had matched the average of comparable EU countries’ investment in health capital (as a share of GDP), the UK would have invested £33bn more between 2010 and 2019 (around 55% higher than actual investment in that period).
Funding, not systems is the key
The statistics in this article indicate the impact of the decision of David Cameron’s 2010 government to impose the brutal austerity regime that has so hobbled health care in England.
Just as Tony Blair’s government took the decision in 2000 to raise NHS spending towards European levels, Cameron’s government began the process that has reduced real terms spending once again.
It’s wrong to blame today’s problems on the UK’s “Beveridge-style” system in which funding flows from general taxation, and expect that a change to a “Bismarck-style” social insurance would magically transform the situation. What matters is not the system but the amount of funding.
A 2015 study of the financing of health systems exposes the weaknesses in social insurance systems and concludes:
“In conclusion, employment contributions as a source of health financing are incompatible with universal coverage, quality of services, and rising life expectancy. A move towards general taxation to meet health care needs can boost economic growth through increased competitiveness, and achieve major non-health objectives, like equity, financial protection, quality and responsiveness even during economic downturns.
“Health system sustainability, as a system objective, must turn to financing through progressive taxation of all types of income. … National health insurance financed through taxation should gain momentum in the quest for more sustainable and responsive health systems.”
[1] Australia, Canada, Denmark, France, Germany, the Netherlands, Sweden, Switzerland and the USA.

Dear Reader,
If you like our content please support our campaigning journalism to protect health care for all.
Our goal is to inform people, hold our politicians to account and help to build change through evidence based ideas.
Everyone should have access to comprehensive healthcare, but our NHS needs support. You can help us to continue to counter bad policy, battle neglect of the NHS and correct dangerous mis-infomation.
Supporters of the NHS are crucial in sustaining our health service and with your help we will be able to engage more people in securing its future.
Please donate to help support our campaigning NHS research and journalism.